2MA Cross with Glow Effects 2MA Cross with Glow Effects
Overview
This indicator enhances the classic moving average crossover strategy with a dynamic and visually appealing "glow" effect. It plots two customisable moving averages on the chart and illuminates the area around them when a crossover occurs, providing a clear and intuitive signal for potential trend changes.
Features
Dual Moving Averages: Configure two independent moving averages to suit your trading style.
Multiple MA Types: Choose from a wide range of moving average types for each line, including:
SMA (Simple Moving Average)
EMA (Exponential Moving Average)
WMA (Weighted Moving Average)
VWMA (Volume-Weighted Moving Average)
RMA (Relative Moving Average)
HMA (Hull Moving Average)
ALMA (Arnaud Legoux Moving Average)
LSMA (Least Squares Moving Average)
Customisable Appearance: Adjust the length, line width, and color for each moving average.
Unique Glow Effect: A configurable glow appears around the moving averages during a crossover, providing an unmistakable visual cue. You can control the intensity and width of this effect.
How It Works
The core of the indicator is the calculation of two moving averages based on the user's selected type and length. The script continuously monitors the relationship between these two MAs.
The "glow" is a sophisticated visual effect achieved by using Pine Script's `fill()` function to create a smooth, colored gradient around the MA lines. The glow is conditionally rendered:
When the first moving average (MA1) crosses above the second (MA2), MA1 will glow above its line.
When MA1 crosses below MA2, it will glow below its line.
The same logic is applied to MA2, creating a dual-glow effect that clearly shows which MA is dominant.
To ensure a consistent visual appearance across different chart timeframes, the indicator incorporates a `tfMultiplier` that automatically adjusts the glow's width.
How to Use
This indicator can be used in the same way as a standard moving average crossover strategy
Bullish Signal: Look for the shorter-period moving average to cross above the longer-period moving average. The glow effect will make this event highly visible.
Bearish Signal: Look for the shorter-period moving average to cross below the longer-period moving average.
Traders can use this for trend identification, entry/exit signals, and as a component of a more comprehensive trading system. For example, a common setup is using a 20-period EMA and a 50-period EMA to capture medium-term trends.
Disclaimer
This indicator is designed as a technical analysis tool and should be used in conjunction with other forms of analysis and proper risk management.
Past performance does not guarantee future results, and traders should thoroughly test any strategy before implementing it with real capital.
Cerca negli script per "moving average crossover"

Strategy Builder With IndicatorsThis strategy script is designed for traders who enjoy building systems using multiple indicators.
Please note: This script does not include any built-in indicators. Instead, it works by referencing the plot outputs of the indicators you’ve already added to your chart.
For example, if you add a MACD and an ATR indicator to your chart, you can assign their plot values as inputs in the settings panel of this strategy.
• MACD as a trigger
• ATR as a filter
How Filters Work
Filters check whether certain conditions are met before a trade can be opened. For instance, if you set a filter like ATR > 30, then no trade will be executed unless that condition is true — even if the trigger fires.
All filters are linked, meaning every active filter must be satisfied for a trade to occur.
How Triggers Work
Triggers are what actually fire a trade signal — such as a moving average crossover or RSI breaking above a specific level. Unlike filters, triggers are independent. Only one active trigger needs to be true for the trade to execute.
Thanks to its modular structure, this strategy can be used with any indicator of your choice.
⸻
Risk Management Features
In the settings, you’ll find flexible options for:
• Stop Loss (SL)
• Trailing Stop Loss (TSL)
• Multi Take-Profit (TP)
These features enhance trade safety and let you tailor your risk management.
SL types available:
• Tick-based SL
• Percent-based SL
• ATR-based SL
Once you select your preferred SL type, you can fine-tune its distance using the offset field.
Trailing SL allows your stop to follow price as it moves in your favor — helping to lock in profits.
Multi-TP lets you take profits at two different levels, helping you secure gains while leaving room for extended moves.
Breakeven option is also available to automatically move your SL to entry after reaching a profit threshold.
⸻
How to Build a Solid Strategy
Let’s break down a good setup into three key components:
1. Trend Filter
Avoid trading against the trend — that’s like swimming against the current.
Use a filter like:
• Supertrend
• Momentum indicators
• Candlestick bias, etc.
Example: In this case, I used Supertrend and filtered for trades only if the price is above the uptrend line.
2. Trigger Condition
Once we confirm the trend is on our side, we need a trigger to execute at the right moment. This can be:
• RSI cross
• Candlestick patterns
• Trendline breaks
• Moving average crossovers, etc.
Example: I used RSI crossing above 50 as the entry trigger.
3. Risk Management
Even in the right trend at the right time — anything can happen. That’s why you should always define Stop Loss and Take Profit levels.
⸻
And there you have it! Your strategy is ready to backtest, refine, and deploy with alerts for live trading.
Questions or suggestions? Feel free to reach out

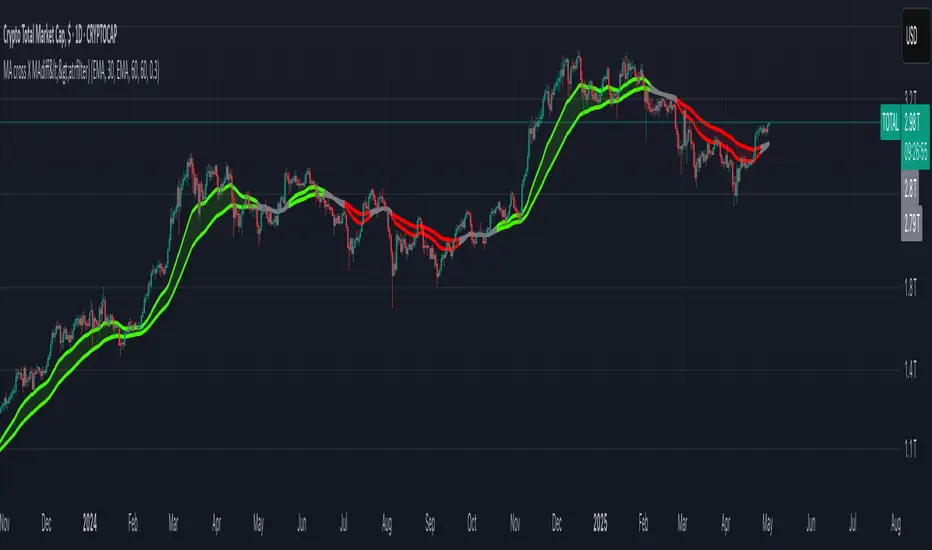
MA cross X MAdiff<>atrfilter)📈 MA cross X MAdiff<>ATR filter
Smarter Trend Confirmation Using Adaptive Volatility Thresholds
🔍 What It Does
This indicator upgrades classic moving average crossovers by adding volatility awareness via ATR filtering. Instead of reacting to every small crossover, it waits for the distance between two moving averages to exceed a volatility-adjusted threshold, making signals more meaningful and less noisy.
⚙️ Core Logic
Calculates the difference between a Fast MA and a Slow MA.
Uses Average True Range (ATR) as a dynamic volatility filter.
Confirms trend only when MA difference exceeds:
diff > ATR × multiplier → Bullish
diff < -ATR × multiplier → Bearish
Otherwise: Neutral (gray zone)
The gray zone avoids false signals by detecting indecision or choppy markets.
🧠 Customizable Inputs
Choose any MA type independently for Fast and Slow:
SMA, EMA, WMA, VWMA, RMA, DEMA, TEMA, LSMA, Kijun
Control sensitivity via:
ATR Length
ATR Multiplier
✅ Why It Works
Reduces fake outs in ranging markets.
Adapts to volatility automatically.
Fully customizable for any asset or style.
Ideal for trend traders, momentum entries, or as a confluence layer.
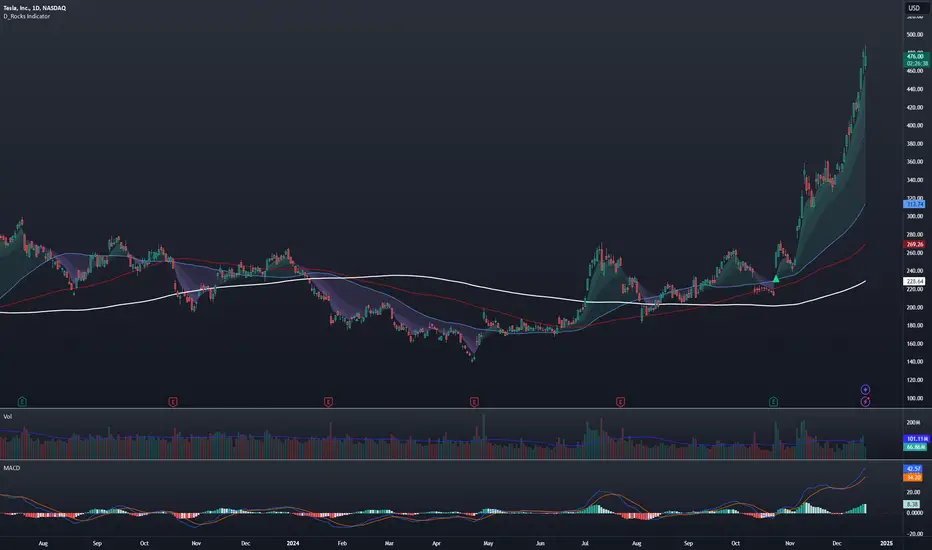
D_Rock's MA IndicatorD_Rock's Moving Average Indicator
This is an indicator version of my strategy linked here
**Overview:**
The basic concept of this indicator is to generate a signal when a faster/shorter length moving average crosses over (for Longs) or crosses under (for Shorts) a medium/longer length moving average. All of which are customizable. This indicator can work on any timeframe, however the daily is the timeframe used for the default settings and screenshots, as it was designed to be a multi-day swing strategy. Once a signal has been confirmed with a candle close, based on user options, the strategy is to enter the trade on the open of the next candle.
The crossover strategy is nothing new to trading, but what can make this strategy unique and helpful, is the addition of further confirmation points before a signal is generated along with the ability to show multiple moving averages on the chart if you choose. Each moving average pair can also be turned into a "cloud" instead of the traditional lines, for additional viewing preferences. Just about everything visual can be toggled on/off as well.
This indicator is a Trend (MA) indicator with optional confirmation points using a Momentum (MACD) indicator. While a Volume-based indicator is not shown here, one could consider using their favorite from that category to further compliment the signal idea.
If you would like to see the backtesting results for your favorite moving average crossover/under, please see my strategy version linked here .
Shoutout given to Ripster's Clouds Indicator as pieces of that code were taken and modified to create both the Cloud visualization effects, and the Moving Average Pair Plots that are implemented in this strategy.
MOVING AVERAGE OPTIONS
Select between and change the length & type of up to 5 pairs (10 total) of moving averages
The "Show Cloud-x" option will display a fill color between the "a" and "b" pairs
All moving averages lines can be toggled on/off in the "Style" tab, as well as adjusting their colors.
Visualization features do not affect calculations, meaning you could have all or nothing on the chart and the strategy will still produce results
SIGNAL CHOICES
Choose the fast/shorter length MA and the medium/longer length MA to determine the entry signal
CONFIRMATION OPTIONS
Both of these have customizable values and can be toggled on/off
A candle close over a slower/much longer length moving average
An additional cross-over (cross-under for Shorts) on the MACD indicator using default MACD values. While the MACD indicator is not necessary to have on the chart, it can help to add that for visualization. The calculations will perform whether the indicator is on the chart or not.
ADDITIONAL PLOTS
MACD (Moving Average Convergence/Divergence):
- The MACD is an optional confirmation indicator for this strategy.
- Plotting the indicator is not necessary for the strategy to work, but it can be helpful to visually see the status and position of the MACD if this feature is enabled in the strategy
- This helps to identify if there is also momentum behind the entry signal
RSI based MAGot it! Here’s some information in English specifically about the **RSI-based Moving Average (RSI-based MA)** that we wrote the Pine Script code for:
### RSI-Based Moving Average (RSI-based MA)
An **RSI-based Moving Average (RSI-based MA)** is a technical analysis tool that combines the Relative Strength Index (RSI) with moving averages to provide more insight into market trends and potential reversals. This indicator can be particularly useful for identifying the beginning and end of trends, allowing traders to make more informed decisions.
### How RSI-based MA Works
The RSI-based MA indicator calculates the moving average of the RSI values rather than the asset's price itself. In the script you asked for, we implemented two RSI-based moving averages: one for a 1-minute timeframe and another for a 5-minute timeframe. This dual timeframe approach can help traders spot trends more accurately and identify shifts in momentum across different time periods.
#### Key Features of RSI-based MA:
1. **Dual Timeframe Analysis**:
- The script plots two RSI-based moving averages on the same chart:
- **1-minute RSI-based MA**: A moving average calculated based on RSI values over a 1-minute interval.
- **5-minute RSI-based MA**: A moving average calculated based on RSI values over a 5-minute interval.
- Using different timeframes helps traders see both short-term and longer-term trends simultaneously.
2. **RSI Levels**:
- The RSI-based MA plots values between 0 and 100, similar to the RSI itself. Traders can use typical RSI levels, such as 70 (overbought) and 30 (oversold), to identify potential entry and exit points.
- **Overbought condition**: When the RSI-based MA moves above 70, it indicates the asset might be overbought, suggesting a potential for price to drop.
- **Oversold condition**: When the RSI-based MA drops below 30, it signals that the asset might be oversold, indicating a potential price increase.
3. **Crossovers**:
- **Bullish signal**: If the shorter 1-minute RSI-based MA crosses above the longer 5-minute RSI-based MA, this could indicate a new upward trend beginning.
- **Bearish signal**: Conversely, if the 1-minute RSI-based MA crosses below the 5-minute RSI-based MA, it could suggest the beginning of a downward trend.
### Potential Advantages
- **Smoother Trend Identification**: By applying moving averages to RSI, you can smooth out the short-term fluctuations in RSI values, making it easier to identify the underlying trend.
- **Versatility**: The indicator can be customized for different timeframes and settings, allowing it to be tailored to various trading strategies and asset classes.
- **Enhanced Signals**: Combining RSI and moving averages helps filter out noise, providing more reliable signals for potential trend changes or continuations.
### Potential Limitations
- **Lagging Indicator**: Like most moving averages, RSI-based MAs are lagging indicators. They tend to react after price movements have already begun, which could result in delayed signals.
- **False Signals**: In ranging or highly volatile markets, RSI-based MA may give false signals, indicating a trend reversal or continuation that does not occur.
- **Should Not Be Used Alone**: It's often recommended to use RSI-based MA alongside other technical indicators (like MACD, Bollinger Bands, or moving average crossovers) to confirm signals and reduce the risk of false readings.
### Conclusion
The RSI-based MA can be a powerful tool for traders looking to enhance their understanding of market trends and momentum. By combining RSI with moving averages, traders can smooth out RSI readings and gain a clearer view of the market’s direction. However, as with any indicator, it should be used in conjunction with other tools and strategies to maximize its effectiveness and reduce risk.

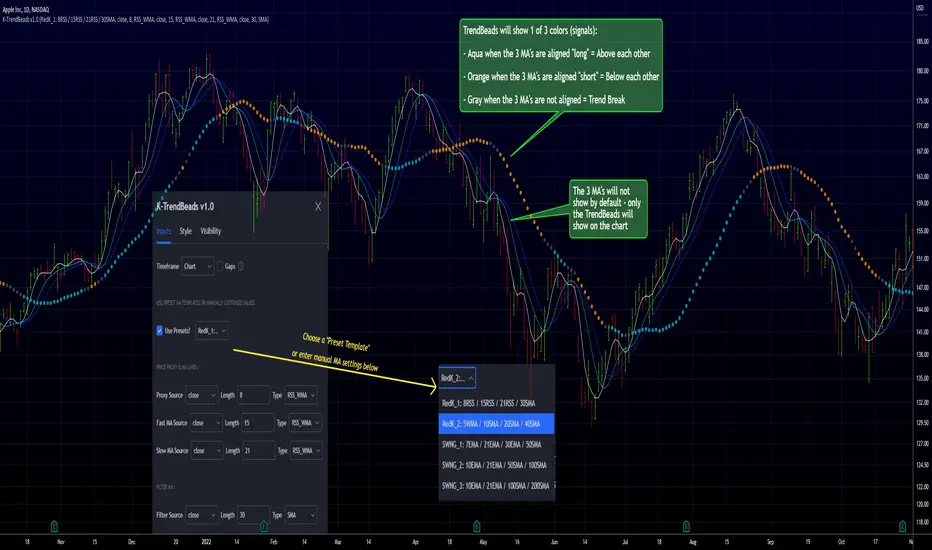
RedK TrendBeads: 3 x MA Crossover Signal with Preset TemplatesRedK TrendBeads is a super simple 3 x Moving Average Crossover Signal (Long/Short/Break) script that provides a simple and effective way for traders to identify potential trading opportunities. By combining three moving averages and only exposing a simple signal, the script helps filter out noise and focus on the trend and the trade execution.
Background
===========
A 3 x Moving Average Crossover strategy is a popular trading method in technical analysis . It uses the relationship between a fast, medium, and slow moving averages to generate buy or sell signals.
The approach usually utilizes three moving averages to track the average price of a financial instrument over different time periods. By comparing the fast, medium, and slow moving averages, we can generates a signal to trade long or short
If the fast moving average crosses above the medium moving average and the medium moving average is above the slow moving average, we have a probability of an up-trend forming, and we generate a signal to go long. Conversely, if the fast moving average crosses below the medium moving average and the medium moving average is below the slow moving average, we have a probability of a down-trend forming, and we generate a signal to go short. When the moving averages are not in the right order (above or below each other), we have a trend break, usually on consolidation or base forming.
in TrendBeads, the fastest MA is called "Price Proxy MA" and will be used with a relatively short length to represent the price itself - then there are the Fast MA, Slow MA and a Filter MA (usually with the longest/slowest length) which is the main line that will be used to plot the TrendBeads - So the TrendBeads will represent the state of the other 3 Moving Average lines (Proxy, Fast and Slow) and how they are aligned - and it will also be common to use the Filter / Beads line itself as a main filter, i.e., take long positions *only* when the price action is above the Filter MA, and short positions *only* when the price is below the Filter MA.
So what is different with TrendBeads:
=====================================
Simplicity, No Clutter: I put this together to provide a super simple mechanism to track trend on the price chart without so much noise as i also wanted to have other top-chart indicators (like LadderTrader) - so TrendBeads only shows the "beads" on the chart - they act like "traffic lights" with little distracting information - Simplicity here was deliberately part if the idea
Presets, What others are Watching: The other feature I needed was the ability to track price action against "different sets" of Moving Averages quickly - for example, when executing short-term trades, I needed to use Moving Averages with shorter length and want to utilize my RSS_WMA MA type - but when assessing big breakout opportunities, I need to analyze price action against a different set of MA's with (usually) longer length and mainly SMA's (hint, The Minervini template) - This is where the built-in Preset Templates become very useful.
Having these preset templates quickly available (thru the dropdown in indicator settings) provides time saving, convenience and the confidence that we're looking at what other traders are using in their analysis - so not missing out on key-level breakouts or reversals
TrendBeads v1.0 includes the following 5 preset MA templates
======================================================
Preset 1 : RedK_1: 8RSS / 15RSS / 21RSS / 30SMA
Preset 2 : RedK_2: 5WMA / 10SMA / 20SMA / 40SMA
Preset 3 : SWNG_1: 7EMA / 21EMA / 30EMA / 50SMA
Preset 4 : SWNG_2: 10EMA / 21EMA / 50SMA / 100SMA
Preset 5 : SWNG_3: 10EMA / 21EMA / 100SMA / 200SMA
The above presets represent some of the most common sets of MA's traders use in various scenarios (Short-term/day trading, Swing, Long term / growth). Well, except for the first one since it utilizes my own RSS_WMA :) which I use in many charts
I may add some more presets in future.
below chart shows an example of different presets against AAPL for the same time range / window
There's also the ability to manually set different MA source price, MA type and length for each of the 4 MA lines. Supported MA types are SMA , EMA , WMA , HMA and my RSS_WMA
TrendBeads Usage Tips:
=====================
*If you have used any MA crossover (2 lines or 3 lines) on your chart, your should find TradeBeads very easy to use. TrendBeads works the same way except that the signal will show as colored beads on the Filter MA line instead of showing multiple crossing lines .. and that is by design.
* Feel free to expose any or all of the individual MA lines - for example, i find that exposing the Proxy Line helps in quickly finding famous chart patterns ( cup & handle , H&S ..etc)
* Experiment with the different presets depending on the type of trade you're working on (swing, long term growth candidates, day trades..etc)
* Note that in a long trend up (Aqua Beads), usually the first gray + orange sequence will usually act as a "reversal sign" - and are usually not actionable - always look for the "second" color sequence to action/trade .. Same thing for a long trend down -- get used to how the beads change color against the trend changes and play with various timeframes.
* As usual - we should have other indicators that track strength, volume , etc and ensure proper confirmation before trade execution - A good signal is only a small part of a trade - risk management and good trade execution are key to winning.
Hope some fellow traders will find this useful - feel free to leave me any comments or feedback - Good luck!
Sequentially Filtered Moving AverageThe previously proposed sequential filter aimed to filter variations lower than a certain period, this allowed to remove noisy variations and retain only the closing price values that occurred after a consecutive up/down, however because of the noisy nature of the closing price large filtering was impossible, in order to tackle to this problem the same indicator using a simple moving average as input is proposed, this allow for smoother results.
We will see that the proposed indicator can provide an alternative moving average that could be used as slow moving average in crossover systems.
The Indicator
The length parameter as the same function as the one described in the sequential filter post, however here length also control the period of the moving average used input, in short larger values of length will return a smoother but less reactive output.
In blue the moving average with length = 200, and in red the moving average with length = 50.
It is interesting to see how the moving average remain flat during ranging/flat market periods
Unfortunately like the sequential filter the sequentially filtered moving average (SFMA) is not affected by large short term variations such as gaps or short term volatile events. This is because of the nature of the sequential filter to ignore movements amplitude and only focus on the variation period.
Moving Average Crossover System
The SFMA is equal to a simple moving average of period length when a consecutive up/down sequence of size length has occurred, else the SFMA is equal to its precedent value, therefore we could expect less crosses between a fast moving average and the SFMA as slow moving average.
We can see on the figure above that the fast moving average of period 50 (in green) cross more with the slow moving average of period 200 (in red) than with the SFMA of period 200 (in blue).
Crosses can occur at the same time as with the classical slow moving average (in red) or a bit later.
Conclusion
A new moving average based on the recently proposed sequential filter has been proposed, it can be seen that under a moving average crossover system the proposed moving average seems to be more effective at producing less crosses without necessarily doing it with an excessive lag, in fact the moving average has either lag (length-1)/2 or lag length .
In the future it could be interesting to provide an hybrid alternative that take into account volatility as well as variations period.
Thanks for reading !

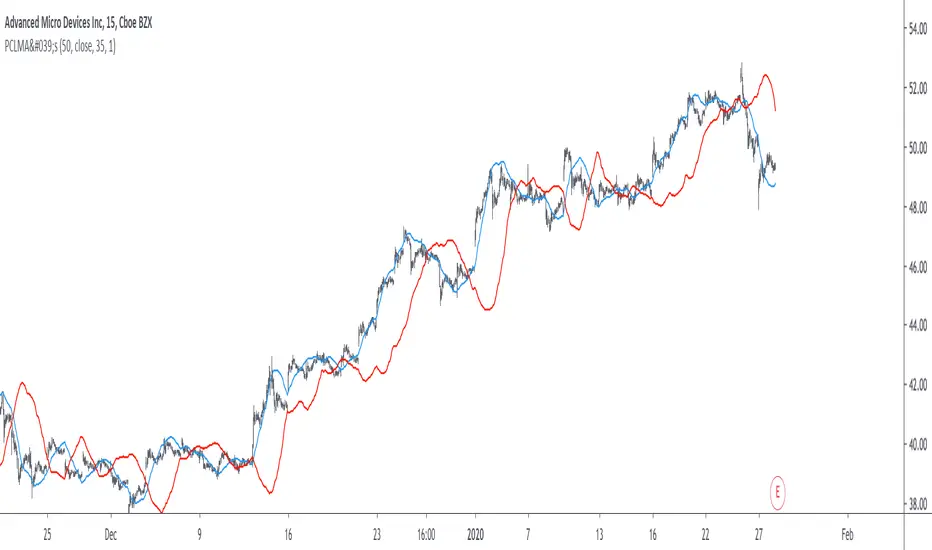
Parametric Corrective Linear Moving AveragesImpulse responses can fully describe their associated systems, for example a linearly weighted moving average (WMA) has a linearly decaying impulse response, therefore we can deduce that lag is reduced since recent values are the ones with the most weights, the Blackman moving average (or Blackman filter) has a bell shaped impulse response, that is mid term values are the ones with the most weights, we can deduce that such moving average is pretty smooth, the least squares moving average has negative weights, we can therefore deduce that it aim to heavily reduce lag, and so on. We could even estimate the lag of a moving average by looking at its impulse response (calculating the lag of a moving average is the aim of my next article with Pinescripters) .
Today a new moving average is presented, such moving average use a parametric rectified linear unit function as weighting function, we will see that such moving average can be used as a low lag moving average as well as a signal moving average, thus creating a moving average crossover system. Finally we will estimate the LSMA using the proposed moving average.
Correctivity And The Parametric Rectified Linear Unit Function
Lot of terms are used, each representing one thing, lets start with the easiest one,"corrective". In some of my posts i may have used the term "underweighting", which refer to the process of attributing negative weights to the input of a moving average, a corrective moving average is simply a moving average underweighting oldest values of the input, simply put most of the low lag moving averages you'll find are corrective. This term was used by Aistis Raudys in its paper "Optimal Negative Weight Moving Average for Stock Price Series Smoothing" and i felt like it was a more elegant term to use instead of "low-lag".
Now we will describe the parametric rectified linear unit function (PReLU), this function is the one used as weighting function and is not that complex. This function has two inputs, alpha , and x , in short if x is greater than 0, x remain unchanged, however if x is lower than 0, then the function output is alpha × x , if alpha is equal to 1 then the function is equivalent to an identity function, if alpha is equal to 0 then the function is equivalent to a rectified unit function.
PReLU is mostly used in neural network design as an activation function, i wont explain to you how neural networks works but remember that neural networks aim to mimic the neural networks in the brain, and the activation function mimic the process of neuron firing. Its a super interesting topic because activation functions regroup many functions that can be used for technical indicators, one example being the inverse fisher RSI who make use of the hyperbolic tangent function.
Finally the term parametric used here refer to the ability of the user to change the aspect of the weighting function thanks to certain settings, thinking about it, it isn't a common things for moving averages indicators to let the user modify the characteristics of the weighting function, an exception being the Arnaud Legoux moving average (ALMA) which weighting function is a gaussian function, the user can control the peak and width of the function.
The Indicator
The indicator has two moving averages displayed on the chart, a trigger moving average (in blue) and a signal moving average (in red), their crosses can generate signals. The length parameter control the filter length, with higher values of length filtering longer term price fluctuations.
The percentage of negative weights parameter aim to determine the percentage of negative weights in the weighting function, note that the signal moving average won't use the same amount and will use instead : 100 - Percentage , this allow to reverse the weighting function thus creating a more lagging output for signal. Note that this parameter is caped at 50, this is because values higher than 50 would make the trigger moving average become the signal moving average, in short it inverse the role of the moving averages, that is a percentage of 25 would be the same than 75.
In red the moving average using 25% of negative weights, in blue the same moving average using 14% percent of negative weights. In theory, more negative weights = less lag = more overshoots.
Here the trigger MA in blue has 0% of negative weights, the trigger MA in green has however 35% of negative weights, the difference in lag can be clearly seen. In the case where there is 0% of negative weights the trigger become a simple WMA while the signal one become a moving average with linearly increasing weights.
The corrective factor is the same as alpha in PReLU, and determine the steepness of the negative weights line, this parameter is constrained in a range of (0,1), lower values will create a less steep negative weights line, this parameter is extremely useful when we want to reduce overshoots, an example :
here the corrective factor is equal to 1 (so the weighting function is an identity function) and we use 45% of negative weights, this create lot of overshoots, however a corrective factor of 0.5 reduce them drastically :
Center Of Linearity
The impulse response of the signal moving average is inverse to the impulse response of the trigger moving average, if we where to show them together we would see that they would crosses at a point, denoted center of linearity, therefore the crosses of each moving averages correspond to the cross of the center of linearity oscillator and 0 of same period.
This is also true with the center of gravity oscillator, linear covariance oscillator and linear correlation oscillator. Of course the center of linearity oscillator is way more efficient than the proposed indicator, and if a moving average crossover system is required, then the wma/sma pair is equivalent and way more efficient, who would know that i would propose something with more efficient alternatives ? xD
Estimating A Least Squares Moving Average
I guess...yeah...but its not my fault you know !!! Its a linear weighting function ! What can i do about it ?
The least squares moving average is corrective, its weighting function is linearly decreasing and posses negative weights with an amount of negative weights inferior to 50%, now we only need to find the exact percentage amount of negative weights. How to do it ? Well its not complicated if we recall the estimation with the WMA/SMA combination.
So, an LSMA of period p is equal to : 3WMA(p) - 2SMA(p) , each coefficient of the combination can give us this percentage, that is 2/3*100 = 33.333 , so there are 33.33% percent of negative weights in the weighting function of the least squares moving average.
In blue the trigger moving average with percentage of negative values et to 33.33, and in green the lsma of both period 50.
Conclusion
Altho inefficient, the proposed moving averages remain extremely interesting. They make use of the PReLU function as weighting function and allow the user to have a more accurate control over the characteristics of the moving averages output such as lag and overshoot amount, such parameters could even be made adaptive.
We have also seen how to estimate the least squares moving average, we have seen that the lsma posses 33.333...% of negative weights in its weighting function, another useful information.
The lsma is always behind me, not letting me focus on cryptobot super profit indicators using massive amount of labels, its like each time i make an indicator, the lsma come back, like a jealous creature, she want the center of attention, but you know well that the proposed indicator is inefficient ! Inefficient elegance (effect of the meds) .
Thanks for reading !
Everyday 0003 _ MAC Pullback I recently posted a Moving Averge Crossover strategy for my Everyday project - a project I've given myself where I try to create one strategy everyday in between 15 minutes and 2 hours.
In the comments of my last published idea, user SignalTradersUK was very kind and suggested I try the following in my next study:
"i think your next study should be, to workout what to do after the Moving Average cross! If you look just on the chart you have posted, Price would appear to always come back to the levels where the 2 MA's cross and then go back in the direction of the crossing of the MA's. It's a great pull back strategy."
I'm really just beginning to learn about coding strategies so I'm not 100% sure I correctly understood his suggestion.
I admit I had difficulties wrapping my head around how to do this.
Anyway, the result is a strategy which runs alongside the main Moving Average Crossover.
'The Algorithm'
When the fast and slow MA cross the strategy traces back 40 days to find a swing low.
This swing low and the price at the MA cross is used to calculate a fib 1.272 extension.
The price at this 1.272 extension is used to place a Pullback short order.
Since we're shorting a bull trend, a tight stop is used.
If the pullback reaches down to the fib 0.618 we take profit (close the short).
Like I said, I don't know if I correctly understood SignalTradersUK feedback, but I really appreciate the
feedback and advice!
As always I'm hoping to learn from the community, so all feedback, corrections and advice is very welcome!
Thanks!
/pbergden

Universal Scalper Indicator [Crypto/Forex/Gold]Universal Scalper Pro is an all-in-one scalping system designed for the 15-Minute Timeframe. It automates the analysis of trend, volatility, and risk management into a single, high-contrast dashboard.
Unlike standard crossover indicators, this system filters out low-volatility "noise" using a built-in ADX engine and automatically calculates dynamic Stop Loss and Take Profit levels based on market volatility (ATR).
It is engineered to work universally on:
Crypto (BTC, ETH, SOL, Altcoins)
Commodities (Gold, Silver, Oil)
Forex (Major & Minor Pairs)
Stocks (High volume tech stocks like NVDA, TSLA)
📈 How It Works (The Strategy)
1. The Trend Engine (9/21 EMA) The core logic utilizes a Fast (9) and Slow (21) Exponential Moving Average crossover.
Bullish Signal: The 9 EMA crosses above the 21 EMA.
Bearish Signal: The 9 EMA crosses below the 21 EMA. This specific combination is chosen for its responsiveness to 15-minute intraday trends.
2. The Noise Filter (ADX > 15) To prevent "whipsaws" (fake signals during sideways markets), the script includes a Volatility Filter based on the Average Directional Index (ADX).
Signals are rejected if the ADX is below 15.
This ensures you only receive alerts when there is sufficient momentum to sustain a move.
3. Dynamic Risk Management (ATR) The script uses the Average True Range (ATR) to calculate Stop Loss and Take Profit levels that adapt to the specific asset's volatility.
Stop Loss: Placed at 1.5x ATR from the entry. (Tight enough to preserve capital, wide enough to survive standard market noise).
Take Profit: Placed at 2.0x ATR from the entry. (Provides a healthy 1:1.3 Risk/Reward ratio).
🚀 Key Features
Universal Dashboard: A bottom-right panel displays the live Trend Status, Entry Price, Stop Loss, and Take Profit. It automatically formats decimals for any asset (e.g., 2 decimals for Gold, 5 for Forex, 8 for Crypto).
"Sticky" Memory: The dashboard retains the prices of the last valid signal, allowing you to manage your trade even after the signal candle closes.
Trend Cloud: A visual Green/Red zone between the EMAs helps you instantly identify the market bias.
Unified Alerts: A single alert setup ("Any alert() function call") sends the Asset Name, Entry, SL, and TP directly to your phone.
🛠️ How to Use
Timeframe: Set your chart to 15 Minutes (15m).
Wait for the Signal: Look for the "BUY" (Green) or "SELL" (Red) label on the chart.
Check the Dashboard: Ensure the "STATUS" is BULLISH (for buys) or BEARISH (for sells). If the status says "WAIT", do not trade.
Execute: Enter the trade using the exact Stop Loss and Take Profit levels shown on the dashboard.
⚠️ Risk Disclaimer
Trading financial markets involves high risk and may not be suitable for all investors. This indicator is a technical analysis tool and does not constitute financial advice. Past performance is not indicative of future results. Always practice with a demo account before trading real capital.

7/21 EMA ADX Pro After many months (actually years) of intense research, countless hours of testing different approaches, and rigorous backtesting, I’ve finally developed this indicator/strategy based on moving average crossovers enhanced with power-based filtering to significantly reduce false signals and whipsaws. This is not just another basic MA crossover system. The core idea revolves around applying mathematical powers (exponents) to the moving averages and combining them with additional confirmation filters, creating a much more robust and reliable signal generation mechanism. I’m sharing it with the community in the hope that it can be useful to someone else who, like me, has spent endless nights trying to find an edge in the markets. Feel free to test it, modify it, or improve it. Feedback, suggestions, and constructive criticism are always welcome. If you find it helpful, a simple like or comment would mean a lot — it’s the result of a huge amount of work and passion. Happy trading! (Full Pine Script code will be posted below or in the next update — stay tuned!

CVD Strength | VTS Pro🔷 CVD Strength | VTS Pro
By Alireza Mossaheb
Description:
CVD Strength is a powerful tool designed to analyze market momentum by visualizing the Cumulative Volume Delta (CVD) using advanced techniques. This indicator provides a multi-timeframe view of volume delta behavior and highlights strong and weak bullish/bearish conditions based on volume spikes, candle size, and optional moving average filters.
Key Features:
Multi-timeframe CVD candle plotting with color-coded strength signals
Optional EMA (21), WMA (30), and SMA (50) overlays for trend filtering
Smart strength detection logic using volume, candle size, and moving average crossovers
Bullish and bearish crossover signals marked on chart
Customizable anchor and lower timeframes for flexible analysis
Alerts users when data vendor does not supply volume information
This script is particularly useful for identifying institutional buying/selling pressure and can be used effectively in both trend-following and mean-reversion strategies.

TMO (True Momentum Oscillator)TMO ((T)rue (M)omentum (O)scilator)
Created by Mobius V01.05.2018 TOS Convert to TV using Claude 3.7 and ChatGPT 03 Mini :
TMO calculates momentum using the delta of price. Giving a much better picture of trend, tend reversals and divergence than momentum oscillators using price.
True Momentum Oscillator (TMO)
The True Momentum Oscillator (TMO) is a momentum-based technical indicator designed to identify trend direction, trend strength, and potential reversal points in the market. It's particularly useful for spotting overbought and oversold conditions, aiding traders in timing their entries and exits.
How it Works:
The TMO calculates market momentum by analyzing recent price action:
Momentum Calculation:
For a user-defined length (e.g., 14 bars), TMO compares the current closing price to past open prices. It assigns:
+1 if the current close is greater than the open price of the past bar (indicating bullish momentum).
-1 if it's less (indicating bearish momentum).
0 if there's no change.
The sum of these scores gives a raw momentum measure.
EMA Smoothing:
To reduce noise and false signals, this raw momentum is smoothed using Exponential Moving Averages (EMAs):
First, the raw data is smoothed by an EMA over a short calculation period (default: 5).
Then, it undergoes additional smoothing through another EMA (default: 3 bars), creating the primary "Main" line of the indicator.
Lastly, a "Signal" line is derived by applying another EMA (also default: 3 bars) to the main line, adding further refinement.
Trend Identification:
The indicator plots two lines:
Main Line: Indicates current momentum strength and direction.
Signal Line: Acts as a reference line, similar to a moving average crossover system.
When the Main line crosses above the Signal line, it suggests strengthening bullish momentum. Conversely, when the Main line crosses below the Signal line, it indicates increasing bearish momentum.
Overbought/Oversold Levels:
The indicator identifies key levels based on the chosen length parameter:
Overbought zone (positive threshold): Suggests the market might be overheated, and a potential bearish reversal or pullback could occur.
Oversold zone (negative threshold): Suggests the market might be excessively bearish, signaling a potential bullish reversal.
Clouds visually mark these overbought/oversold areas, making it easy to see potential reversal zones.
Trading Applications:
Trend-following: Traders can enter positions based on crossovers of the Main and Signal lines.
Reversals: The overbought and oversold areas highlight high-probability reversal points.
Momentum confirmation: Use TMO to confirm price action or other technical signals, improving trade accuracy and timing.
The True Momentum Oscillator provides clarity in identifying momentum shifts, making it a valuable addition to various trading strategies.

Exposure Oscillator (Cumulative 0 to ±100%)
Exposure Oscillator (Cumulative 0 to ±100%)
This Pine Script indicator plots an "Exposure Oscillator" on the chart, which tracks the cumulative market exposure from a range of technical buy and sell signals. The exposure is measured on a scale from -100% (maximum short exposure) to +100% (maximum long exposure), helping traders assess the strength of their position in the market. It provides an intuitive visual cue to aid decision-making for trend-following strategies.
Buy Signals (Increase Exposure Score by +10%)
Buy Signal 1 (Cross Above 21 EMA):
This signal is triggered when the price crosses above the 21-period Exponential Moving Average (EMA), where the current bar closes above the EMA21, and the previous bar closed below the EMA21. This indicates a potential upward price movement as the market shifts into a bullish trend.
buySignal1 = ta.crossover(close, ema21)
Buy Signal 2 (Trending Above 21 EMA):
This signal is triggered when the price closes above the 21-period EMA for each of the last 5 bars, indicating a sustained bullish trend. It confirms that the price is consistently above the EMA21 for a significant period.
buySignal2 = ta.barssince(close <= ema21) > 5
Buy Signal 3 (Living Above 21 EMA):
This signal is triggered when the price has closed above the 21-period EMA for each of the last 15 bars, demonstrating a strong, prolonged uptrend.
buySignal3 = ta.barssince(close <= ema21) > 15
Buy Signal 4 (Cross Above 50 SMA):
This signal is triggered when the price crosses above the 50-period Simple Moving Average (SMA), where the current bar closes above the 50 SMA, and the previous bar closed below it. It indicates a shift toward bullish momentum.
buySignal4 = ta.crossover(close, sma50)
Buy Signal 5 (Cross Above 200 SMA):
This signal is triggered when the price crosses above the 200-period Simple Moving Average (SMA), where the current bar closes above the 200 SMA, and the previous bar closed below it. This suggests a long-term bullish trend.
buySignal5 = ta.crossover(close, sma200)
Buy Signal 6 (Low Above 50 SMA):
This signal is true when the lowest price of the current bar is above the 50-period SMA, indicating strong bullish pressure as the price maintains itself above the moving average.
buySignal6 = low > sma50
Buy Signal 7 (Accumulation Day):
An accumulation day occurs when the closing price is in the upper half of the daily range (greater than 50%) and the volume is larger than the previous bar's volume, suggesting buying pressure and accumulation.
buySignal7 = (close - low) / (high - low) > 0.5 and volume > volume
Buy Signal 8 (Higher High):
This signal occurs when the current bar’s high exceeds the highest high of the previous 14 bars, indicating a breakout or strong upward momentum.
buySignal8 = high > ta.highest(high, 14)
Buy Signal 9 (Key Reversal Bar):
This signal is generated when the stock opens below the low of the previous bar but rallies to close above the previous bar’s high, signaling a potential reversal from bearish to bullish.
buySignal9 = open < low and close > high
Buy Signal 10 (Distribution Day Fall Off):
This signal is triggered when a distribution day (a day with high volume and a close near the low of the range) "falls off" the rolling 25-bar period, indicating the end of a bearish trend or selling pressure.
buySignal10 = ta.barssince(close < sma50 and close < sma50) > 25
Sell Signals (Decrease Exposure Score by -10%)
Sell Signal 1 (Cross Below 21 EMA):
This signal is triggered when the price crosses below the 21-period Exponential Moving Average (EMA), where the current bar closes below the EMA21, and the previous bar closed above it. It suggests that the market may be shifting from a bullish trend to a bearish trend.
sellSignal1 = ta.crossunder(close, ema21)
Sell Signal 2 (Trending Below 21 EMA):
This signal is triggered when the price closes below the 21-period EMA for each of the last 5 bars, indicating a sustained bearish trend.
sellSignal2 = ta.barssince(close >= ema21) > 5
Sell Signal 3 (Living Below 21 EMA):
This signal is triggered when the price has closed below the 21-period EMA for each of the last 15 bars, suggesting a strong downtrend.
sellSignal3 = ta.barssince(close >= ema21) > 15
Sell Signal 4 (Cross Below 50 SMA):
This signal is triggered when the price crosses below the 50-period Simple Moving Average (SMA), where the current bar closes below the 50 SMA, and the previous bar closed above it. It indicates the start of a bearish trend.
sellSignal4 = ta.crossunder(close, sma50)
Sell Signal 5 (Cross Below 200 SMA):
This signal is triggered when the price crosses below the 200-period Simple Moving Average (SMA), where the current bar closes below the 200 SMA, and the previous bar closed above it. It indicates a long-term bearish trend.
sellSignal5 = ta.crossunder(close, sma200)
Sell Signal 6 (High Below 50 SMA):
This signal is true when the highest price of the current bar is below the 50-period SMA, indicating weak bullishness or a potential bearish reversal.
sellSignal6 = high < sma50
Sell Signal 7 (Distribution Day):
A distribution day is identified when the closing range of a bar is less than 50% and the volume is larger than the previous bar's volume, suggesting that selling pressure is increasing.
sellSignal7 = (close - low) / (high - low) < 0.5 and volume > volume
Sell Signal 8 (Lower Low):
This signal occurs when the current bar's low is less than the lowest low of the previous 14 bars, indicating a breakdown or strong downward momentum.
sellSignal8 = low < ta.lowest(low, 14)
Sell Signal 9 (Downside Reversal Bar):
A downside reversal bar occurs when the stock opens above the previous bar's high but falls to close below the previous bar’s low, signaling a reversal from bullish to bearish.
sellSignal9 = open > high and close < low
Sell Signal 10 (Distribution Cluster):
This signal is triggered when a distribution day occurs three times in the rolling 7-bar period, indicating significant selling pressure.
sellSignal10 = ta.valuewhen((close < low) and volume > volume , 1, 7) >= 3
Theme Mode:
Users can select the theme mode (Auto, Dark, or Light) to match the chart's background or to manually choose a light or dark theme for the oscillator's appearance.
Exposure Score Calculation: The script calculates a cumulative exposure score based on a series of buy and sell signals.
Buy signals increase the exposure score, while sell signals decrease it. Each signal impacts the score by ±10%.
Signal Conditions: The buy and sell signals are derived from multiple conditions, including crossovers with moving averages (EMA21, SMA50, SMA200), trend behavior, and price/volume analysis.
Oscillator Visualization: The exposure score is visualized as a line on the chart, changing color based on whether the exposure is positive (long position) or negative (short position). It is limited to the range of -100% to +100%.
Position Type: The indicator also indicates the position type based on the exposure score, labeling it as "Long," "Short," or "Neutral."
Horizontal Lines: Reference lines at 0%, 100%, and -100% visually mark neutral, increasing long, and increasing short exposure levels.
Exposure Table: A table displays the current exposure level (in percentage) and position type ("Long," "Short," or "Neutral"), updated dynamically based on the oscillator’s value.
Inputs:
Theme Mode: Choose "Auto" to use the default chart theme, or manually select "Dark" or "Light."
Usage:
This oscillator is designed to help traders track market sentiment, gauge exposure levels, and manage risk. It can be used for long-term trend-following strategies or short-term trades based on moving average crossovers and volume analysis.
The oscillator operates in conjunction with the chart’s price action and provides a visual representation of the market’s current trend strength and exposure.
Important Considerations:
Risk Management: While the exposure score provides valuable insight, it should be combined with other risk management tools and analysis for optimal trading decisions.
Signal Sensitivity: The accuracy and effectiveness of the signals depend on market conditions and may require adjustments based on the user’s trading strategy or timeframe.
Disclaimer:
This script is for educational purposes only. Trading involves significant risk, and users should carefully evaluate all market conditions and apply appropriate risk management strategies before using this tool in live trading environments.

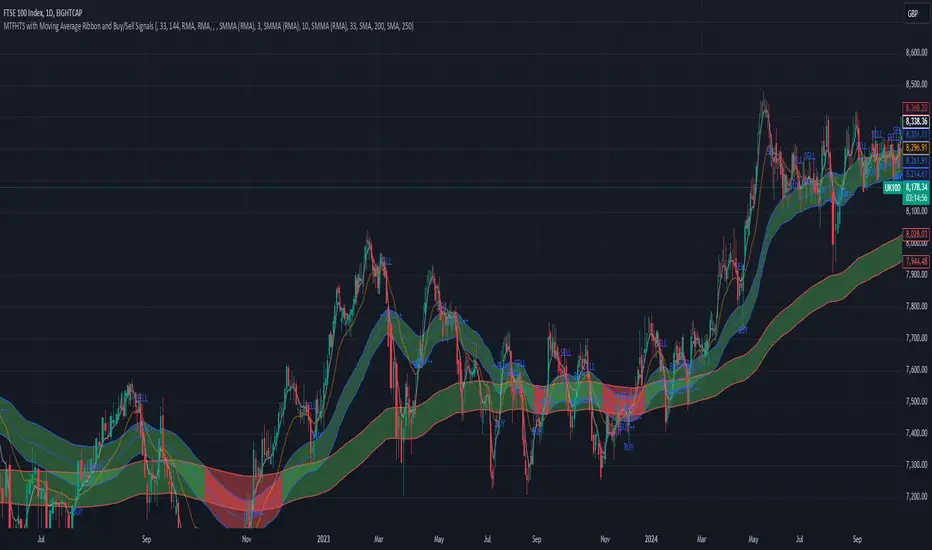
MTFHTS with Moving Average Ribbon and Buy/Sell Signals 3.2Multi-Timeframe Moving Average Strategy with Buy and Sell Signals
Purpose
This strategy is designed to provide clear, data-driven buy and sell signals based on moving average crossovers across multiple timeframes. It aims to help traders identify potential trend reversals and entry/exit points using a systematic approach.
How it Works
Moving Averages Across Multiple Timeframes:
Five customizable moving averages (MA №1 to MA №5) are calculated using different lengths and types, including SMA, EMA, WMA, and VWMA, to suit various trading styles.
The MAs are plotted on different timeframes, allowing traders to visualize trend alignment and identify market momentum across short, medium, and long terms.
Signals for Buying and Selling:
Buy Signals: When the shorter-term MA (MA №1) crosses above a longer-term MA (MA №2 or MA №3), the strategy triggers a buy signal, indicating potential upward momentum.
Sell Signals: When MA №1 crosses below a longer-term MA (MA №2 or MA №3), a sell signal is triggered, suggesting potential downward movement.
Visual Aids and Alerts:
The strategy uses color fills between MAs to indicate bullish (green) or bearish (red) trends, helping traders assess market conditions at a glance.
Alerts for buy and sell signals keep traders notified in real-time, helping to avoid missed opportunities.
Important Note
This strategy is purely educational and does not constitute investment advice. It serves as a tool to help traders understand how multi-timeframe moving averages and crossovers can be used in technical analysis. As with any trading strategy, we recommend testing in a simulated environment and exercising caution.
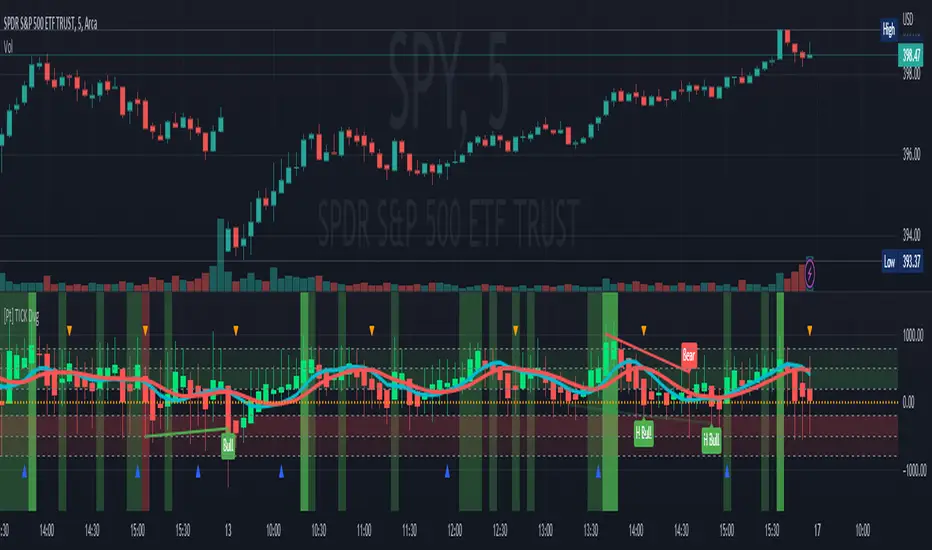
TICK Divergence + Heikin Ashi [Pt]This indicator identifies divergence between NYSE TICK and price, displays TICK in line, bar, or Heikin Ashi format, calculates various types of moving average lines and shows moving average crossovers.
What is TICK
NYSE TICK, also known as the TICK index, is a technical analysis indicator that shows the number of stocks on the New York Stock Exchange (NYSE) that are trading on an uptick or a downtick in a particular period of time. The TICK index is calculated by subtracting the number of stocks trading on a downtick from the number of stocks trading on an uptick. A reading of +1000 on the TICK index, for example, would indicate that there are 1000 more stocks trading on an uptick than on a downtick. The TICK index is often used as a measure of market sentiment, as it can provide insight into whether there is more buying or selling pressure in the market at a given time. A high TICK index reading may suggest that there is strong buying pressure, while a low TICK index reading may indicate that there is more selling pressure in the market.
The TICK index is usually very volatile, so this indicator is best suited for lower timeframes, such as 1 to 5 min charts.
Features
1) Shows bullish, bearish, hidden bullish and hidden bearish divergences
2) Three display modes for TICK data: Line, Bar, Heikin-Ashi
3) Plot various moving average lines and crossovers. Overall background
4) Configurable significant zones. Background colors will change based on closing TICK value.
APEX - Moving Averages [v1]A moving average is the most known indicator that takes into consideration price from the last several periods of the price and calculates a smoothed line also known as a Moving average. This way you will cut out a lot of the noise and have a different view.
The most common usage is the moving average crossover system when you buy and sell when a crossover happens. This system is in general not very profitable but can be used effectively in trending markets.
There is really no general rule to what length should be used. The most well-known and respected lengths are 20 / 50 / 100 / 200 for almost all average. These values are respected as strong resistance and support levels. but if you plan to use a crossover Systems the most profitable settings tend to be when the averages are close together 14 and 28 etc. But this is an area I would appeal to for you to really try out what works and what does not.
Other uses of moving averages are the following:
Crossover system
Moving averages are pointing up and price crosses below (Buy Pullback)
The slow-moving average is Below the fast moving average to help to identify possible bullishness
Can be used as support and resistance lines
If you are an advanced user you may want to try out the following techniques:
Create your own moving average by combining several of those together with the source function
Using the Average True Range to create Keltner Channels
Using Standard deviation to create Bollinger bands (Bollinger bands are also accessible on their own)
You can use Moving averages to smooth the noise on other indicators such as RSI / CCI / MFI
Granville 8-Rule Engine — v6Description:
The Granville 8-Rule Engine systematically implements Joseph Granville's eight original trading rules, which provide a comprehensive framework for interpreting price action relative to a moving average to identify genuine trend changes and avoid false signals.
Granville's methodology focuses on the critical relationship between price movement and the direction of the moving average, recognizing that valid trend changes and continuations exhibit specific behavioral patterns while false breakouts and reversals show characteristic divergences.
The indicator evaluates all eight of Granville's rules and assigns a composite score based on their fulfillment:
Bullish Rules:
Rule 1: Price crosses above a rising moving average (+3 points)
Rule 2: Price remains above a rising moving average after testing support (+2 points)
Rule 3: Price remains above a rising moving average after penetrating below it (+1 point)
Rule 4: Moving average changes from declining to rising (+1 point)
Bearish Rules:
Rule 5: Price crosses below a declining moving average (-3 points)
Rule 6: Price remains below a declining moving average after testing resistance (-2 points)
Rule 7: Price remains below a declining moving average after penetrating above it (-1 point)
The indicator incorporates volume confirmation by adding or subtracting additional points when significant volume accompanies the fulfillment of bullish or bearish rules, respectively.
A buy signal is generated when the composite score reaches +4 or higher, indicating multiple bullish rules are simultaneously satisfied. A sell signal is generated when the score reaches -4 or lower, indicating multiple bearish rules are in effect.
This systematic approach filters out many false breakout and whipsaw signals by requiring multiple confirmatory conditions rather than relying on simple moving average crossovers. The scoring mechanism provides a quantitative measure of the strength of the prevailing trend relationship, enabling traders to distinguish between genuine trend development and deceptive price movements that fail to confirm with the moving average direction.
The Granville 8-Rule Engine provides a disciplined, rule-based method for determining whether price movements represent valid trend continuation, genuine trend reversal, or potentially misleading counter-trend activity that is likely to fail. By requiring multiple confirmatory conditions from Granville's established rules, the indicator helps traders avoid premature entries and provides higher-probability signals for participating in sustained trend movements.

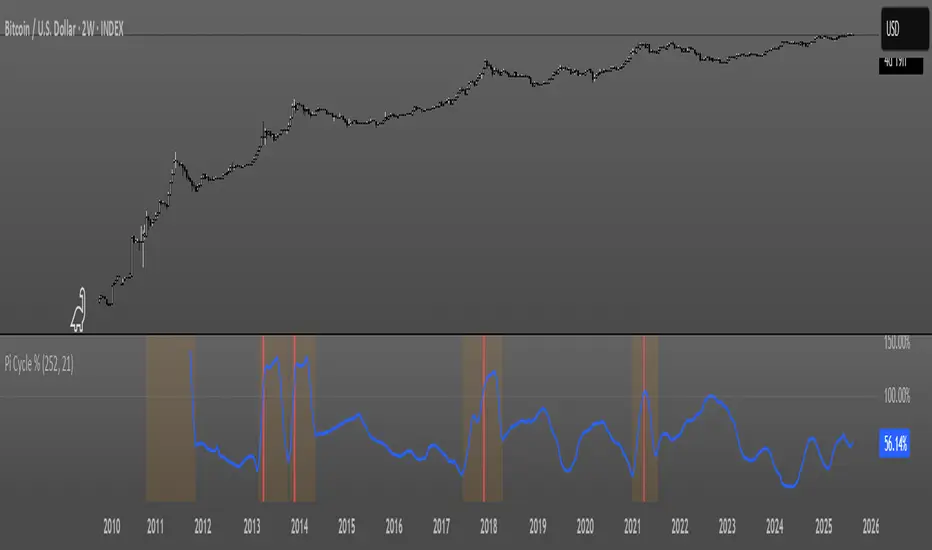
Pi Cycle OscillatorThis oscillator combines the Pi Cycle Top indicator with a percentile-based approach to create a more precise and easy to read market timing tool.
Instead of waiting for moving average crossovers, it shows you exactly how close you are to a potential market top.
Orange background means you should start preparing for a potential top and look into taking profits.
Red background means that the crossover has happened on the original Pi Cycle Indicator and that you should have already sold everything. (Crossover of the gray line aka 100)
Thank you
Bollinger Band Width Percentile - The_Caretaker
Pi Cycle Top - megasyl20
OB/OS adaptative v1.1# OB/OS Adaptative v1.1 - Multi-Timeframe Adaptive Overbought/Oversold Indicator
## Overview
The `tradingview_indicator_emas.pine` script is a sophisticated multi-timeframe indicator designed to identify dynamic overbought and oversold levels in financial markets. It combines EMA (Exponential Moving Average) crossovers and Bollinger Bands across monthly, weekly, and daily timeframes to create adaptive support and resistance levels that adjust to changing market conditions.
## Core Functionality
### Multi-Timeframe Analysis
The indicator analyzes three timeframes simultaneously:
- **Monthly (M)**: Long-term trend identification
- **Weekly (W)**: Intermediate-term trend identification
- **Daily (D)**: Short-term volatility measurement
### Technical Indicators Used
- **EMA 9 and EMA 20**: For trend identification and momentum assessment
- **Bollinger Bands (20-period)**: For volatility measurement and extreme level identification
- **Price action**: For confirmation of level validity and signal generation
## Key Features
### Adaptive Level Calculation
The indicator dynamically determines overbought and oversold levels based on market structure and trend bias:
#### Monthly Level Logic
- **Bullish Bias** (when monthly open > EMA20):
- Oversold = lower of EMA9 or EMA20
- Overbought = upper of EMA9 or Bollinger Upper Band
- **Bearish/Neutral Bias** (when monthly open ≤ EMA20):
- Oversold = Bollinger Lower Band
- Overbought = upper of EMA20 or EMA9
#### Weekly Level Logic
- **Bullish Bias** (when weekly open > EMA20):
- Oversold = lower of EMA9 or EMA20
- Overbought = Bollinger Upper Band
- **Bearish/Neutral Bias** (when weekly open ≤ EMA20):
- Oversold = Bollinger Lower Band
- Overbought = upper of EMA20 or EMA9
#### Daily Level Logic
- Simple Bollinger Bands:
- Oversold = Bollinger Lower Band
- Overbought = Bollinger Upper Band
### Final Level Determination
The indicator combines all three timeframes through a weighted averaging process:
1. Calculates initial values as the average of monthly, weekly, and daily levels
2. Ensures mathematical consistency by enforcing overbought_final ≥ oversold_final using min/max functions
3. Calculates a midpoint average level as the center of the range
### Visual Elements
- **Dynamic Lines**: Draws horizontal lines for current and previous period overbought, oversold, and average levels
- **Labels**: Places clear textual labels at the start of each period
- **Color Coding**:
- Red for overbought levels (resistance)
- Green for oversold levels (support)
- Blue for average levels (pivot point)
- **Transparency**: Previous period lines use semi-transparent colors to distinguish between current and historical levels
### Update Mechanism
- **Calculation Day**: User-defined day of the week (default: Monday)
- On the specified calculation day, the indicator:
- Updates all levels based on previous bar's data
- Draws new lines extending forward for a user-defined number of days
- Maintains previous period lines for comparison and trend analysis
- Automatically deletes and recreates lines to ensure clean visualization
### Proximity Detection
- Alerts when price approaches overbought/oversold levels (configurable distance in percentage)
- Helps identify potential reversal zones before actual crossovers occur
- Distance thresholds are user-configurable for both overbought and oversold conditions
### Alert Conditions
The indicator provides four distinct alert types:
1. **Cross below oversold**: Triggered when price crosses below the oversold level
2. **Cross above overbought**: Triggered when price crosses above the overbought level
3. **Near oversold**: Triggered when price approaches the oversold level within the configured distance
4. **Near overbought**: Triggered when price approaches the overbought level within the configured distance
### Debug Mode
When enabled, displays comprehensive debug information including:
- Current values for all levels (oversold, overbought, average)
- Timeframe-specific calculations and raw data points
- System status information (current day, calculation day, etc.)
- Lines existence and timing information
- Organized in multiple labels at different price levels to avoid overlap
## Configuration Parameters
| Parameter | Default Value | Description |
|---------|---------------|-------------|
| Short EMA (9) | 9 | Length for short-term EMA calculation |
| Long EMA (20) | 20 | Length for long-term EMA calculation |
| BB Length | 20 | Period for Bollinger Bands calculation |
| Std Dev | 2.0 | Standard deviation multiplier for Bollinger Bands |
| Distance to overbought (%) | 0.5 | Percentage threshold for "near overbought" alerts |
| Distance to oversold (%) | 0.5 | Percentage threshold for "near oversold" alerts |
| Calculation day | Monday | Day of week when levels are recalculated |
| Lookback days | 7 | Number of days to extend previous period lines backward |
| Forward days | 7 | Number of days to extend current period lines forward |
| Show Debug Labels | false | Toggle for comprehensive debug information display |
## Trading Applications
### Primary Use Cases
1. **Reversal Trading**: Identify potential reversal zones when price approaches overbought/oversold levels
2. **Trend Confirmation**: Use the adaptive nature of levels to confirm trend strength and direction
3. **Position Sizing**: Adjust position size based on distance from key levels
4. **Stop Placement**: Use opposite levels as dynamic stop-loss references
### Strategic Advantages
- **Adaptive Nature**: Levels adjust to changing market volatility and trend structure
- **Multi-Timeframe Confirmation**: Signals are validated across multiple timeframes
- **Visual Clarity**: Clear color-coded lines and labels enhance decision-making
- **Proactive Alerts**: "Near" conditions provide early warnings before crossovers
## Implementation Details
### Data Security
Uses `request.security()` function to fetch data from higher timeframes (monthly, weekly) while maintaining proper bar indexing with ` ` offset for open prices.
### Performance Optimization
- Uses `var` keyword to declare persistent variables that maintain state across bars
- Efficient line and label management with proper deletion before recreation
- Conditional execution of debug code to minimize performance impact
### Error Handling
- Comprehensive NA (not available) checks throughout the code
- Graceful degradation when data is unavailable for higher timeframes
- Mathematical safeguards to prevent invalid level calculations
## Conclusion
The OB/OS Adaptative v1.1 indicator represents a sophisticated approach to identifying market extremes by combining multiple technical analysis concepts. Its adaptive nature makes it particularly useful in trending markets where static levels may be less effective. The multi-timeframe approach provides a comprehensive view of market structure, while the visual elements and alert system enhance its practical utility for active traders.

MA Crossover [AlchimistOfCrypto]🌌 MA Crossover Quantum – Illuminating Market Harmonic Patterns 🌌
Category: Trend Analysis Indicators 📈
"The moving average crossover, reinterpreted through quantum field principles, visualizes the underlying resonance structures of price movements. This indicator employs principles from molecular orbital theory where energy states transition through gradient fields, similar to how price momentum shifts between bullish and bearish phases. Our implementation features algorithmically optimized parameters derived from extensive Python-based backtesting, creating a visual representation of market energy flows with dynamic opacity gradients that highlight the catalytic moments where trend transformations occur."
📊 Professional Trading Application
The MA Crossover Quantum transcends the traditional moving average crossover with a sophisticated gradient illumination system that highlights the energy transfer between fast and slow moving averages. Scientifically optimized for multiple timeframes and featuring eight distinct visual themes, it enables traders to perceive trend transitions with unprecedented clarity.
⚙️ Indicator Configuration
- Timeframe Presets 📏
Python-optimized parameters for specific timeframes:
- 1H: EMA 23/395 - Ideal for intraday precision trading
- 4H: SMA 41/263 - Balanced for swing trading operations
- 1D: SMA 8/44 - Optimized for daily trend identification
- 1W: SMA 32/38 - Calibrated for medium-term position trading
- 2W: SMA 17/20 - Engineered for long-term investment signals
- Custom Settings 🎯
Full parameter customization available for professional traders:
- Fast/Slow MA Length: Fine-tune to specific market conditions
- MA Type: Select between EMA (exponential) and SMA (simple) calculation methods
- Visual Theming 🎨
Eight scientifically designed visual palettes optimized for neural pattern recognition:
- Neon (default): High-contrast green/red scheme enhancing trend transition visibility
- Cyan-Magenta: Vibrant palette for maximum visual distinction
- Yellow-Purple: Complementary colors for enhanced pattern recognition
- Specialized themes (Green-Red, Forest Green, Blue Ocean, Orange-Red, Grayscale): Each calibrated for different market environments
- Opacity Control 🔍
- Variable transparency system (0-100) allowing seamless integration with price action
- Adaptive glow effect that intensifies around crossover points - the "catalytic moments" of trend change
🚀 How to Use
1. Select Timeframe ⏰: Choose from scientifically optimized presets based on your trading horizon
2. Customize Parameters 🎚️: For advanced users, disable presets to fine-tune MA settings
3. Choose Visual Theme 🌈: Select a color scheme that enhances your personal pattern recognition
4. Adjust Opacity 🔎: Fine-tune visualization intensity to complement your chart analysis
5. Identify Trend Changes ✅: Monitor gradient intensity to spot high-probability transition zones
6. Trade with Precision 🛡️: Use gradient intensity variations to determine position sizing and risk management
Developed through rigorous mathematical modeling and extensive backtesting, MA Crossover Quantum transforms the fundamental moving average crossover into a sophisticated visual analysis tool that reveals the molecular structure of market momentum.

Buy Signal Forex & Crypto v0 ImprovedPurpose of the Script:
This script is designed to generate buy and sell signals for trading Forex and cryptocurrencies by analyzing price trends using exponential moving averages (EMAs), volatility, and volume filters. The signals are displayed as arrows on the chart.
What the Script Does
Input Settings:
The script allows the user to configure various settings, such as the lengths of EMAs, a higher timeframe for trend confirmation, and thresholds for volume and volatility (ATR - Average True Range).
Key settings:
5 EMA Length – Length of the short-term EMA.
13 EMA Length – Length of the medium-term EMA.
26 EMA Length – Length of the long-term EMA.
21 EMA Length – Used for trend confirmation on a higher timeframe.
Higher Timeframe – Lets you select a timeframe (e.g., daily) for confirming the overall trend.
ATR Threshold – Filters out signals when the market's volatility is too low.
Volume Filter – Ensures sufficient trading activity before generating signals.
Calculating EMAs (Exponential Moving Averages):
Four EMAs are calculated:
ema5 (short-term), ema13 (medium-term), ema26 (long-term), and ema21 (higher timeframe confirmation).
These EMAs help determine price trends and crossovers, which are critical for identifying buy and sell opportunities.
Trend Confirmation Using a Higher Timeframe:
The 21 EMA on the higher timeframe (e.g., daily) is used to confirm the overall direction of the market.
Defining Signal Conditions:
Buy Signal:
A buy signal is generated when:
ema5 crosses above ema13 (indicating a bullish trend).
ema5 crosses above ema26 (stronger bullish confirmation).
The closing price is above ema5, ema13, ema26, and the 21 EMA on the higher timeframe.
The market's volatility (ATR) is above the defined threshold.
The volume meets the conditions or volume filtering is disabled.
Sell Signal:
A sell signal is generated when:
ema5 crosses below ema13 (indicating a bearish trend).
ema5 crosses below ema26 (stronger bearish confirmation).
The closing price is below ema5, ema13, ema26, and the 21 EMA on the higher timeframe.
The market's volatility (ATR) is above the defined threshold.
The volume meets the conditions or volume filtering is disabled.
Volume Filtering:
Ensures there’s enough trading activity by comparing the current volume to a 20-period moving average of volume.
Persistent Variables:
These variables (crossed13 and crossed13Sell) help track whether the short-term EMA (ema5) has crossed the medium-term EMA (ema13). This prevents false or repeated signals.
Displaying Signals on the Chart:
Buy signals are displayed as green upward arrows below the price.
Sell signals are displayed as red downward arrows above the price.
How It Helps Traders:
This script provides visual cues for potential entry and exit points by combining moving average crossovers, volatility, volume, and higher timeframe trend confirmation. It works well for trending markets and ensures signals are filtered for stronger conditions to reduce noise.

Trend Following Parabolic Buy Sell Strategy [TradeDots]The Trend Following Parabolic Buy-Sell Strategy leverages the Parabolic SAR in combination with moving average crossovers to deliver buy and sell signals within a trend-following framework.
This strategy synthesizes proven methodologies sourced from various trading tutorials available on platforms such as YouTube and blogs, enabling traders to conduct robust backtesting on their selected trading pairs to assess the strategy's effectiveness.
HOW IT WORKS
This strategy employs four key indicators to orchestrate its trading signals:
1. Trend Alignment: It first assesses the relationship between the price and the predominant trendline to determine the directional stance—taking long positions only when the price trends above the moving average, signaling an upward market trajectory.
2. Momentum Confirmation: Subsequent to trend alignment, the strategy looks for moving average crossovers as a confirmation that the price is gaining momentum in the direction of the intended trades.
3. Signal Finalization: Finally, buy or sell signals are validated using the Parabolic SAR indicator. A long order is validated when the closing price is above the Parabolic SAR dots, and similarly, conditions are reversed for short orders.
4. Risk Management: The strategy institutes a fixed stop-loss at the moving average trendline and a take-profit level determinable by a prefixed risk-reward ratio calculated from the moving average trendline. These parameters are customizable by the users within the strategy settings.
APPLICATION
Designed for assets exhibiting pronounced directional momentum, this strategy aims to capitalize on clear trend movements conducive to achieving set take-profit targets.
As a lagging strategy that waits for multiple confirmatory signals, entry into trades might occasionally lag beyond optimal timing.
Furthermore, in periods of consolidation or sideways movement, the strategy may generate several false signals, suggesting the potential need for additional market condition filters to enhance signal accuracy during volatile phases.
DEFAULT SETUP
Commission: 0.01%
Initial Capital: $10,000
Equity per Trade: 70%
Users are advised to adjust and personalize this trading strategy to better match their individual trading preferences and style.
RISK DISCLAIMER
Trading entails substantial risk, and most day traders incur losses. All content, tools, scripts, articles, and education provided by TradeDots serve purely informational and educational purposes. Past performances are not definitive predictors of future results.
